Text Mining Obama vs. Trump Tweets
Since Donald Trump’s inauguration as President, there had been a lot of commentary on the difference between President Trump and Obama. Coming from a liberal school I had primarily heard positive sentiment about Obama and negative sentiment about Trump, but I wanted to compare how this sentiment differed from a collection of people across the world on Twitter. For my project I used Twython which uses Twitter’s API and collected 100 tweets about each candidate. With this data, I found the most commonly used words when people tweeted about Trump and Obama and the positivity/negativity sentiment associated with these presidents. Check out my github repo.
Implementation
I used pickle to help scrape the data off the web and created two queries for Trump using his Twitter handle @theRealDonaldTrump and Obama’s handle @BarackObama.As part of scraping data of the web, I wanted to clean it by removing symbols, punctuation, stop words and white spaces. Slang words were also remove to help with the accuracy of the sentiment analysis and I imported an Oxford dictionary .txt file to ensure the words in the Tweets are legitimate. Finally, I used the Lancaster stem program to help extract only the root of the word. In doing so, we would be able to better count the number of times words were used in a tweet. Without Lancaster words with –ing or –ed would be two separate words such as “loving” or “loved.” Stem caster eliminates these types of words in Tweets so that you can count the core words.
To analyze our data, I first wanted to look at the frequency of each word by creating a dictionary histogram of the words. The keys were unique words that appeared in the collected tweets and the values were the frequencies of each word. I then created a function to show the 10 most frequently occurring words in each dictionary (Obama and Trump).
To analyze the positivity/negativity sentiment of these two candidates, I used the NLTK Vader sentiment analyzer which collected a summary sentiment for each tweet and scored it on a scale from 0 to 1 and then gave me the average of the positive and negative sentiment overall. As a way to compare the two, I used a scatter plot on matplotlib to illustrate the difference. The graph was made by using a loop to iterate through each tweet, determining its sentiment score and appending each score to a list of dictionaries.
Results
When I returned the 10 most common words in the tweets I got the following results:
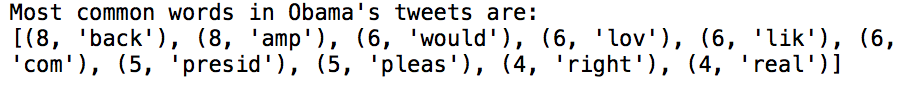
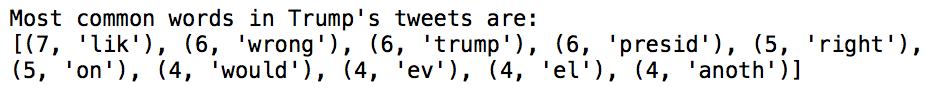
In both Obama and Trump tweets they share the common words “presid”, “like” and “right.” The word “president” or “presidency” makes sense in this context, but it is interesting that the word “right” and “like” is used. It is unclear if the word “like” is used for a simile comparison or in terms of favoring or “liking” a particular candidate. However, we can tell from the average positivity and negativity analysis that Obama is the more favored president where he received more positivity in his tweets and less negativity in his tweets than Trump’s.
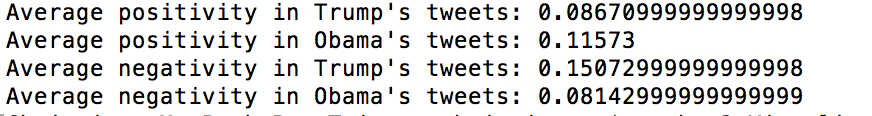
The code I created was able to computes the the average positivity and negativity tweets and also illustrates the tweet number with its positivity/negativity score.
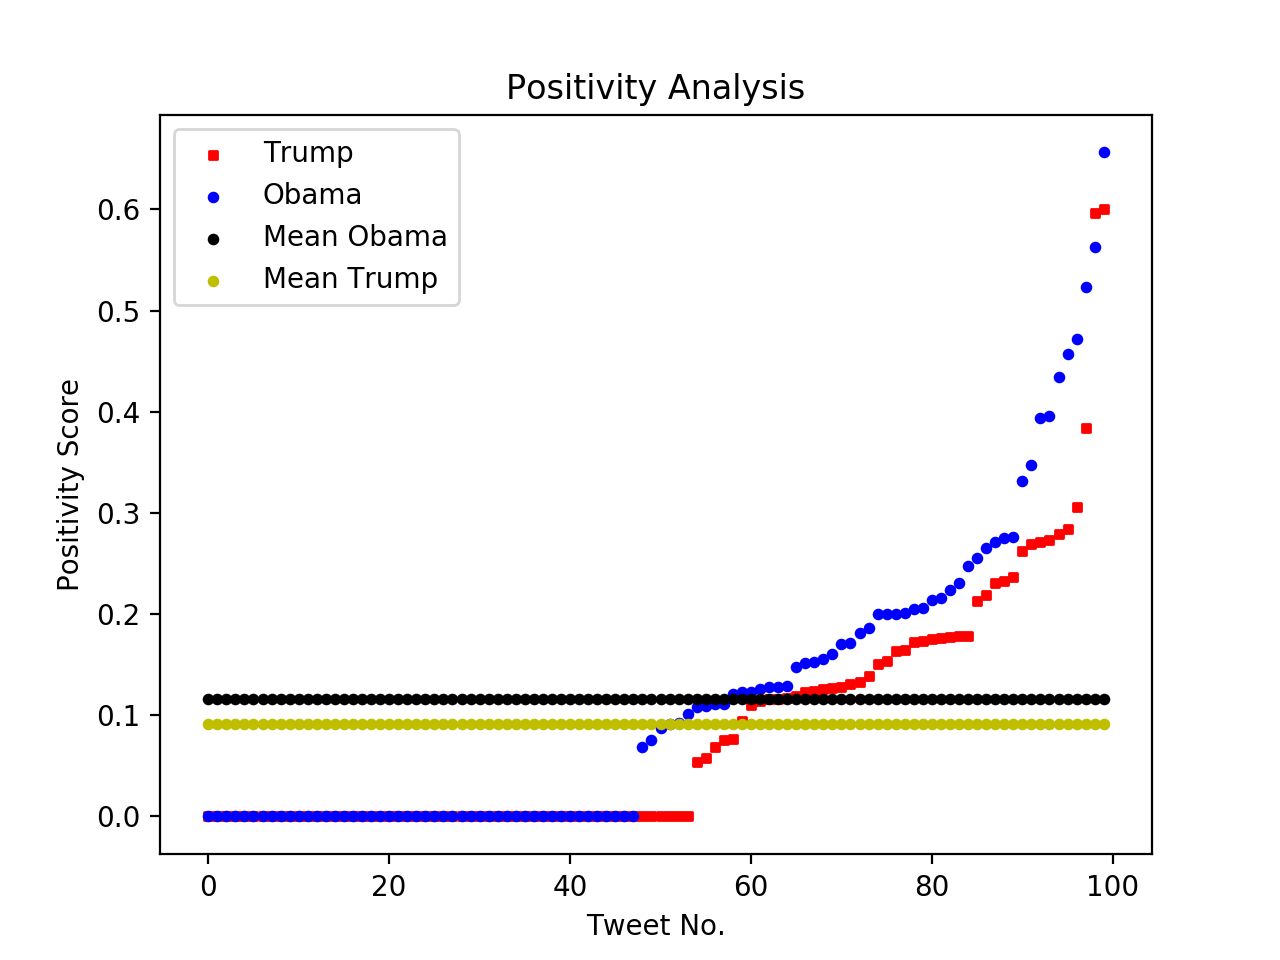
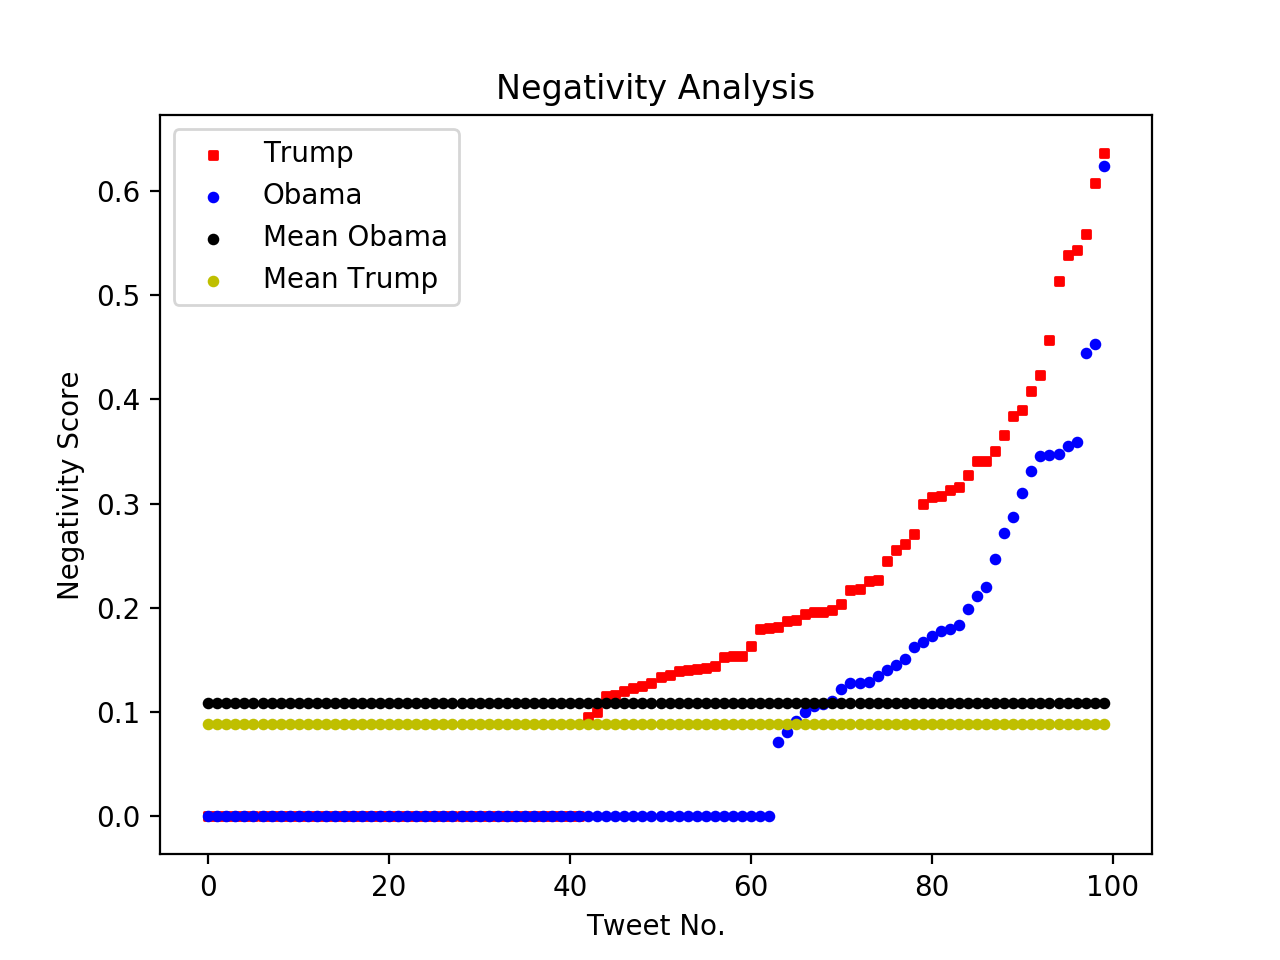
Interestingly, Trump received 2x more negativity in his tweets than Obamas, and Obama received nearly 2x more positivity in his tweets than Trump. Yet it is unclear if there is correlation with the people who are tweeting positive things about Obama are also tweeting negative things about. Another interesting observation about the Positivity Analysis graph is how the curve of both Obama and Trump appear to be the same shape in the beginning but towards the end Obama tweets start to see a much higher positivity score than Trump. For the straight line on both graphs, these were tweets that received a negativity and positivity score of 0, which meant that they were neutral – there were no words included in the text that revealed whether the user favored or disliked another candidate.
Reflection: From a learning point of view, there was a steep learning curve since we were given no templates on how to format a text mining project. I learned that you had to have a web scraping python page separate from the data cleaning (tokenization) and analysis page. I feel like I developed a much better understanding of how dictionaries work in Python as a result of this project and how to protect my consumer key and access token. If I were to do this project again or had more time, I would have liked to included a part that analyzed whether the positive or negative tweets correlated to specific political parties using Indico’s API.